
If you have a website and an online business you need Google analytics, there is no other way with that
By using Google analytics you can get huge data & stats about various aspects of your website, which you can use it to scale your business.
With Google, you get two very powerful free SEO tools,
- Google Analytics
- Google Search Console
In this article, I am going to tell you all about Google Analytics.
Let me be honest with you, when you first take a look at Google analytic dashboard, it is really intimidating and might overwhelm you.
But don’t worry,
In this article, I am going to give you a step by step Google Analytics setup guide checklist & will tell you the benefits of Google analytics
What is Google Analytics?
Google Analytics is a web analytics service tool that is offered by Google which is free to use and has the ability to give in-depth data and stats about the performance of your website.
The in-depth data about website performance and visitor insights that you get in Google Analytics based on these categories
- Real-Time – You can monitor live traffic and its demographics here
- Audience – All the data about your audience
- Acquisition – Here you can monitor channels, sources, medium of your traffic
- Behavior – Here you can monitor what action your traffic is taking when they are on your site.
- Conversions – The action of clicking on your lead magnet, ads that bring some kind of value be money, email contact, or anything else.
All these data are derived on the basis of Google Analytics Dimensions and Metrics
Dimensions – Types of categories in which the data is measured
Metrics – These are quantitative numerical variables.
Dimensions | Metrics |
Browser | Sessions |
Device | Pageviews |
Landing page | Conversions |
Customer type | Bounce rate |
Location | Session duration |
How to Setup Google Analytics?
- Sign in to Google Analytics with your Google Account, if you don’t have a Google account then create and then sign in.
- Once you have signed in, the next step is to enter your business and website, and industry details.
- Once you are done entering the details, agree to the terms and conditions, and your Google Analytics account is opened.
- The next step is to add your tracking code and install it on your wordpress website.
G.A Dashboard > Admin > property > Tracking Info > Tracking Code
- Add the tracking code to the wordpress site using a plugin Insert Header and Footer
WordPress dashboard > Plugin > Add New > Insert Header and Footer > add the google analytics code to the header in the plugin.
Done, your Google Analytics is all set and connected.
- Another method to activate Google Analytics is by using a plugin Google Site Kit.
- Test whether it is working or not.
let’s understand google analytics step by step and see how to use it
Google Analytics Home Page
Once you have logged in, the first glimpse you get is of your Google Analytics Home dashboard.
On the main screen, you get the visual representation of data that you can access easily right there.
Let’s take a look at what they are.
- Audience Overview
2. Real-Time Report
3. Acquisition Report
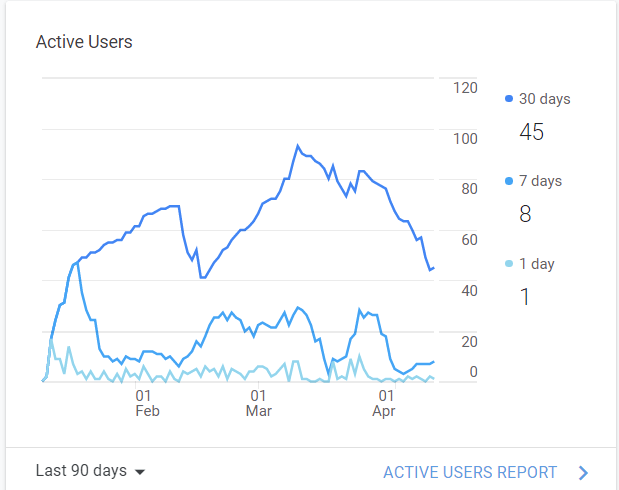
4. Active Users Report
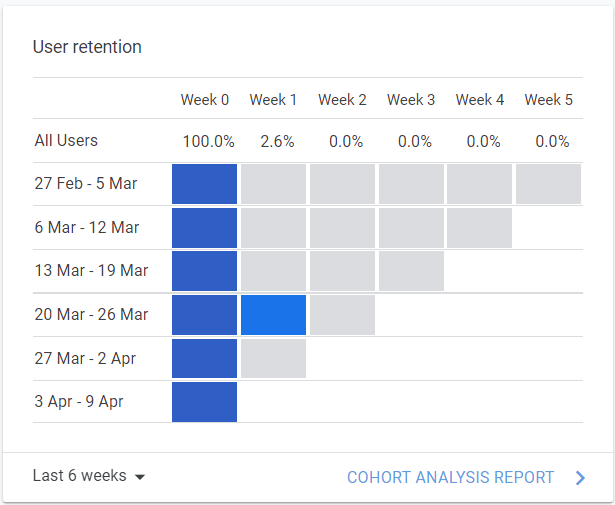
5. Cohort Analysis report
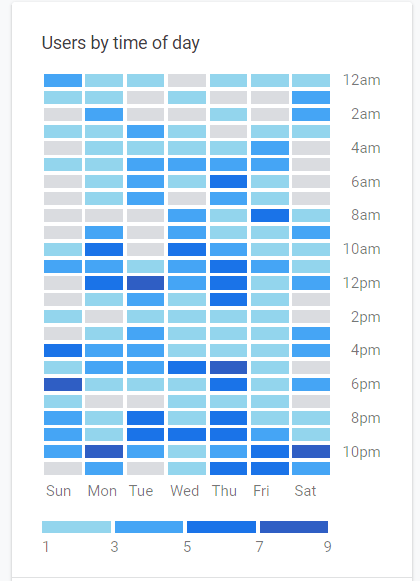
6. Users by time of day
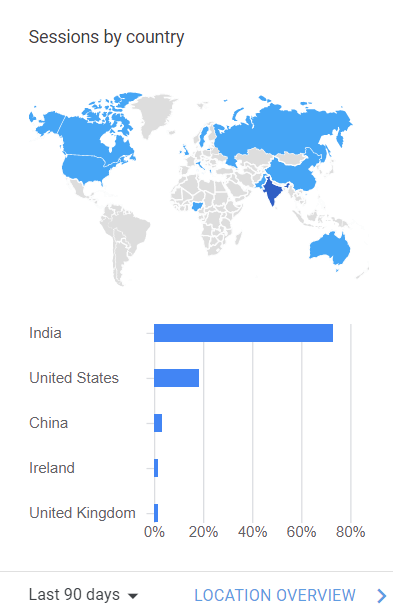
7. Sessions by country
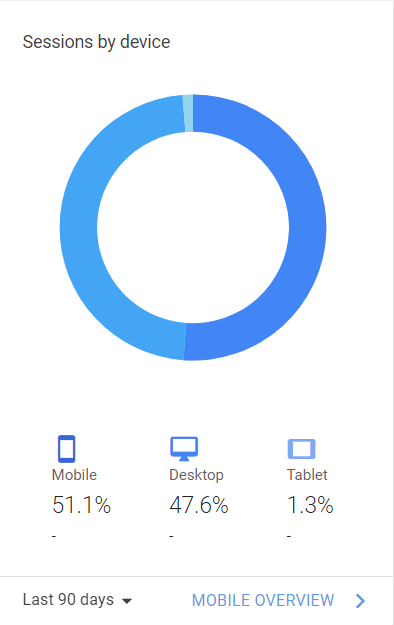
8. Sessions by device
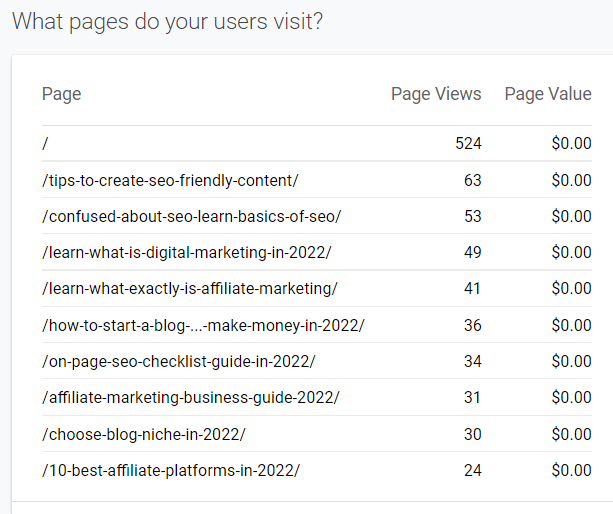
9. What pages do your users visit
Google Analytics Reports
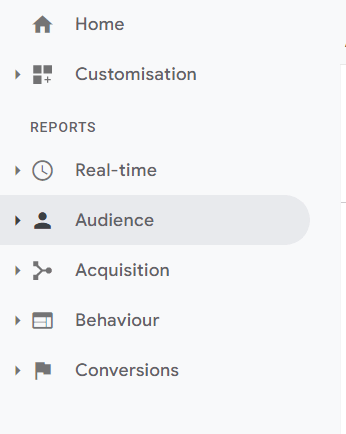
This is where you get to see all the magic and power of Google Analytics which is located in the left sidebar of the page. If you are seeing this for the first time, don’t be intimidated you are not the only one, but i can assure you with time this tool seems pretty easy to understand.
Let’s take a look at each category one by one.
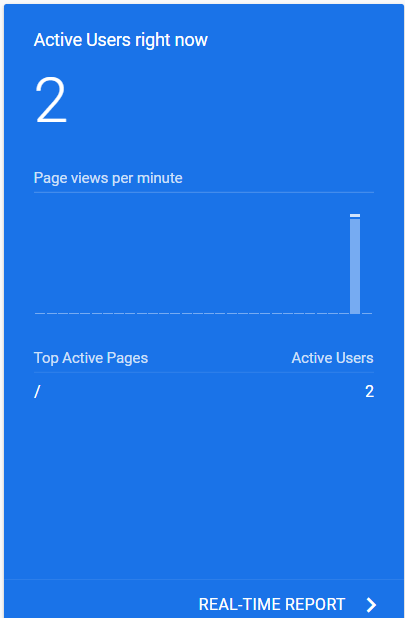
Google Analytics Real-Time
The Real-Time report gives you the data about the live events that are happening on your site.
With this, you can track all the live activities of the users for example,
The number of live users on site, location of the users from where they are coming from, the medium by which they are coming to your site, and which pages they are visiting.
Compared to the rest of the reports this is somewhat of less importance as you can just get the live updates of your blog or products.
If you want to know more about this read this About Real-Time
Google Analytics Audience
In simple language, Audience Reports gives you the data by which you can analyze the overall behavior of your audience/users.
The detailed GA Audience data is derived from all the sub-categories under Audience Reports like Active users, Lifetime value, Cohort Analysis, Audiences, User Explorer, Demographics, Interests, Geo, Behaviour, Technology, Mobile, Cross-Device, Custom, Benchmarking, and Users Flow.
Let’s take a look at the important category segments that you must know.
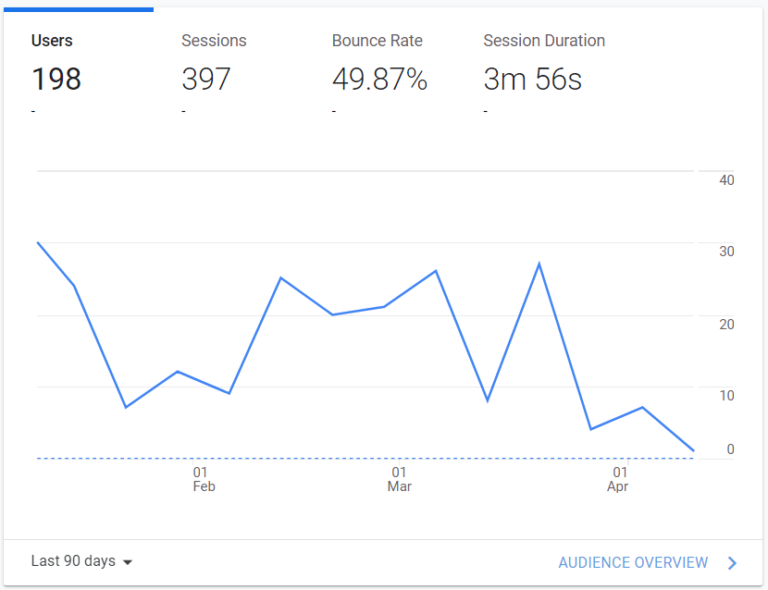
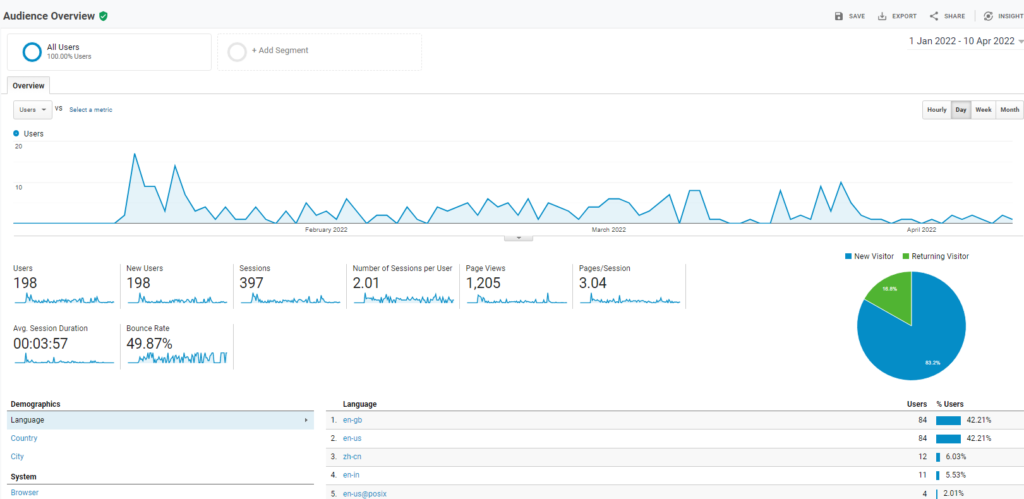
Overview
As the word suggests, you get to see the overall data of all the subcategories in the easiest simple way which can be understood in one glance.
In this section, you get to see the data of such as the users, new users, page views, sessions, average sessions, bounce rate, and many more.
You can check the data based on hour, day, week, and a month or you can also set the dates.
Active Users
The first thing that you need to understand with this report is, it is not the actual live users that are present on your site as many people mistake it for that when they are just getting started.
The active user report gives the data about the new users that have come to your site in a particular set of times like in the last 7 days or the last 14 days etc.
This is a very important data that you should monitor for all your campaigns or new blog posts or anything related to your new marketing strategies as this gives the idea about how the audience reacting to it,
For example
If the number of active users goes high in the first 7 days and then suddenly drops down, then you get the idea about it and can make changes accordingly.

Life Time value
In any online business, you either want to sell something, want to promote something, or want to get traffic to the site,
And for this, you run various marketing campaigns.
With the help of this report LTV you can understand which channel has brought you success and which has not.
Using this data you can then decide where to put your money & focus more.
The LTV data is generated through paid search, social media, organic, affiliates, and many more channels.
You can check the data/metrics of newly acquired users for a day, week, or monthly view.
The data/metrics reports in LTV are based on Pageviews per User, Sessions per User, Sessions Duration per User, Transaction per User, Goal Completion Per User, and Revenue Per User.
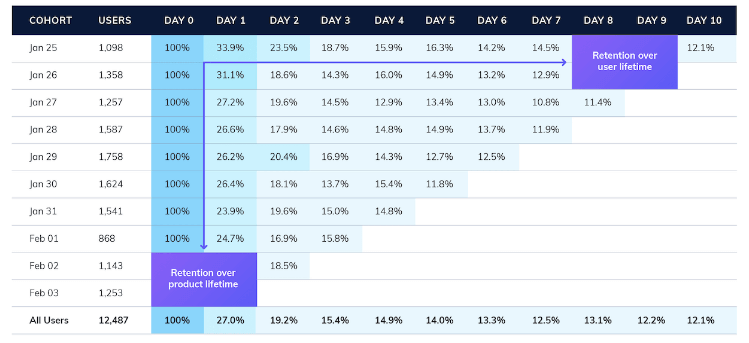
Cohort Analysis
This is a very powerful and useful report that you get in the GA.
The word cohort means “people of the same characteristics”,
So basically the report that you get in cohort analysis is based on the user behavior and categorizing them as per their behavioral traits.
The reports are derived from the acquisition date of the user until they are with you over the period of time.
In simple terms, a cohort is a group of people who you have acquired for something specific in the same phase of time.
You get four main metrics and sub metrics to select in the cohort analysis report
- Cohort Type – this is by default ‘acquisition date’
- Cohort Size – in this you can select the size for a day, week, or month
- Metrics – In this you get three main subcategories and then subcategories for each.
- Per-User – in this you get the average of total metrics and the total size of the cohort. You get multiple options for this like transaction per user, page view per user, revenue per user, and more.
- Retention – the total number of returning users over the period of time for the day, week, month
- Total – You get the total numbers of each sub-category mentioned here.
- Date Range – You can set a maximum of up to 3 months for cohort reports.
There are two main benefits that you can get from having these reports
- Comparing different cohorts at the same stage in their life cycle with you.
- Long term behavior of the cohort
To simplify further,
Let’s say you are a subscription-based company like amazon prime or Netflix
Where users signup and pay $20 a month, now to grow your business you have two elements
- To get more new users to signup
- Retain the acquired users
so as per the example above if you acquired 5000 new users, it becomes very important to know whether they are coming back or not.
This is where the cohort analysis report comes for your help, where you can see how the newly acquired users during the time are behaving collectively over the period of time.
By using this report you can make new strategies for acquisition and retention.
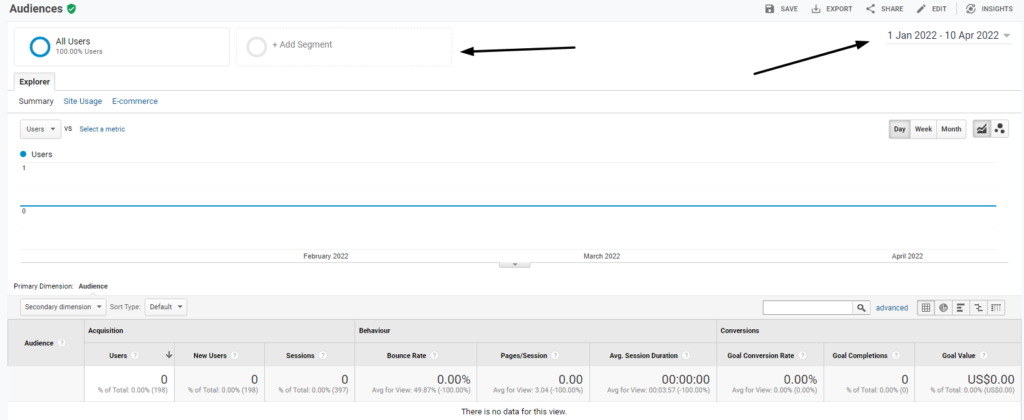
Audiences
The audiences metrics in GA give the data of the behavior and the interest of the users, like how they are interacting with your business in a particular period of time.
For example,
If you are selling two different products, let’s say an eBook and a course
For eBooks with help of a custom audience, you can get the data about how you have acquired the new customers, as in from which marketing channel or traffic channel you have acquired them.
And for courses, you can monitor the data about how the users are interacting with the course with help metrics like page/session, bounce rate, and average session duration.
Lastly, with the help of conversion metrics, you can track how much is your revenue by tracking the number of people who actually bought your course.
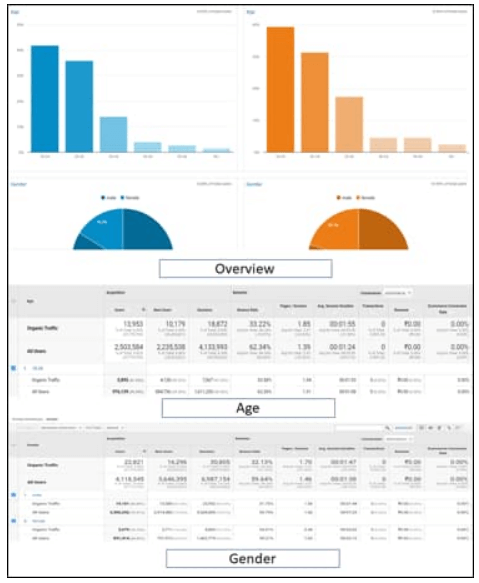
Demographics
The demographics metric gives the data about the age and the gender of the people visiting your site.
As certain products or even content is targeted toward one gender in a specific age bracket, this section becomes very important to monitor their behavior on your site.
The age bracket is divided between 18-24 yrs, 25-34 yrs, 35-44 yrs, 45-54 yrs, 55-64 yrs, and 65+years and the gender is divided between Male and Female.
All the data and the behavior in these metrics is derived on the basis of average sessions, bounce rate, session duration, etc.
Google Analytics Acquisition Report
In simple terms, acquisition reports give you the data about how the users are coming to your site, like from which channels.
Tracking this data is important as it helps you to improve the efficiency of your marketing campaigns.
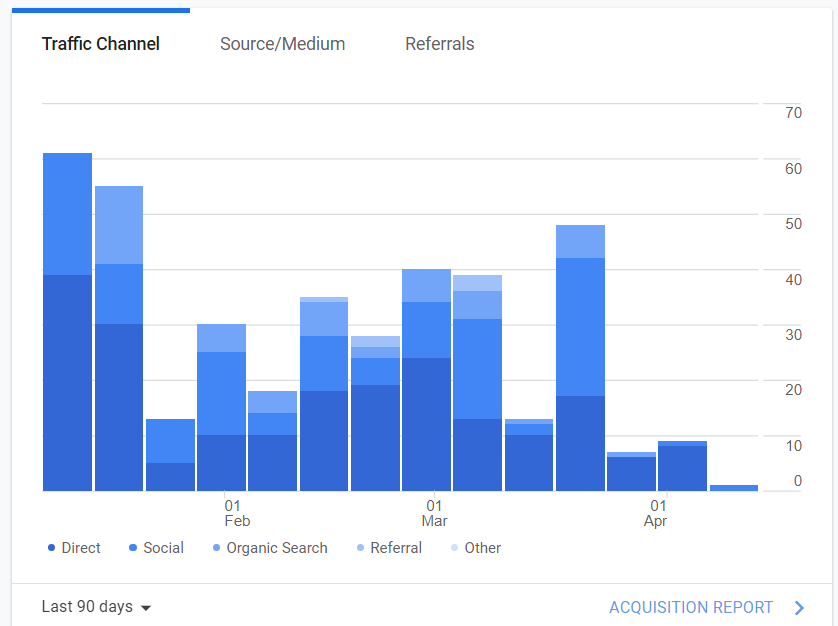
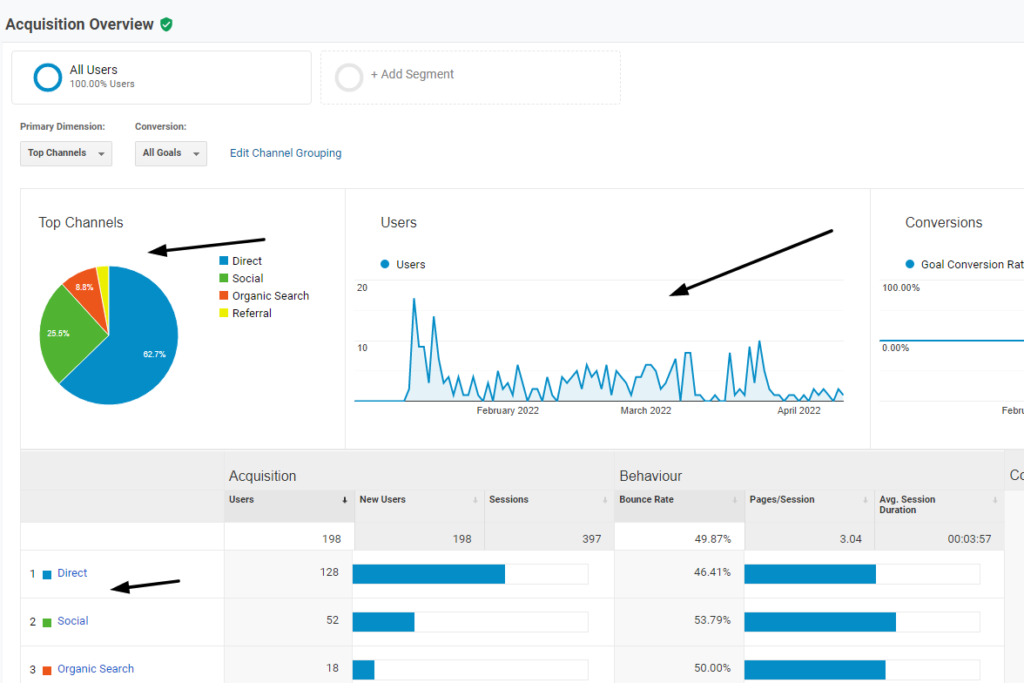
Overview
In the overview, you get the overall traffic data breakdown like organic traffic, direct, social media, etc, which is easy to read.
As seen in the picture below the data is divided into three main categories, let’s take a look at them and learn how to read them
- Acquisition – here you can see all the channels of traffic and the one with the largest bar is bringing the highest traffic. This will help you to identify your best working channel and also optimize the channel that you are using for marketing purposes.
- Behaviour – there are three sub metrics here Bounce rate, Page/session duration, and average duration. This data helps you to understand how your newly acquired users are engaging on-site.
Conversion – same as acquisition the largest bar shows the highest conversion from a particular channel. If you want to optimize one more channel for conversion you can get the data from here.
Acquisition Source/Medium
Here you get in-depth specific channel data on how the traffic is coming to your site. Let’s take a look at the types of traffic channel data you get here.
- Direct – Coming to your site by typing or copy-pasting your URL in the browser
- Social Media – Traffic coming from all the social media links
- co – Twitter
- Organic – Coming from the search engines like bing, google, etc organically
- Referrals – Traffic coming from other websites
- CPC – Paid ads
- Email – traffic coming from email links
Google Analytics Behaviour Reports
As the name suggests this report gives the data about how your users are interacting and engaging when they are on your site.
Under Behaviour reports you get nine different metrics with unique valuable data, lets’s take a look at some important metrics that you must know.
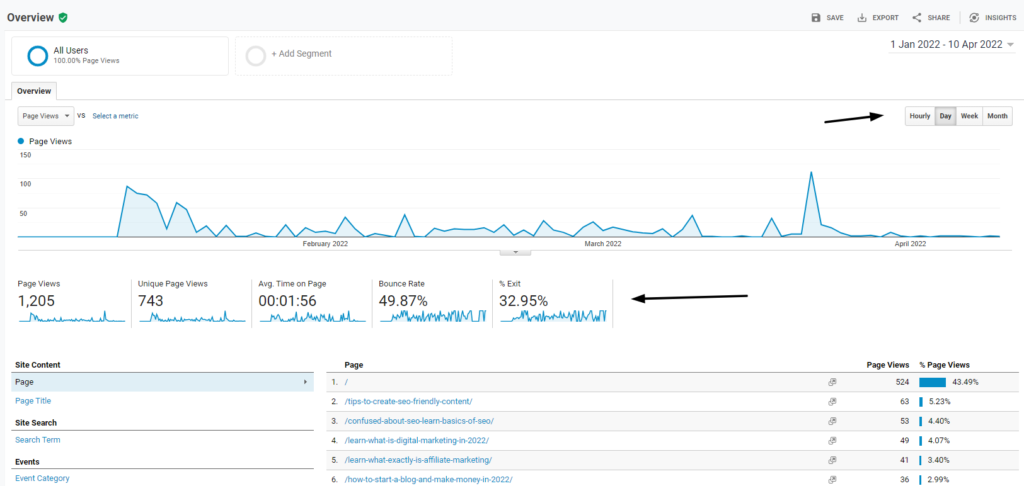
Overview
In this section, you get to see the basic overall data like Pageviews, Unique page views, Avg time on page, bounce rate, the exit of your whole website, and also about each post.
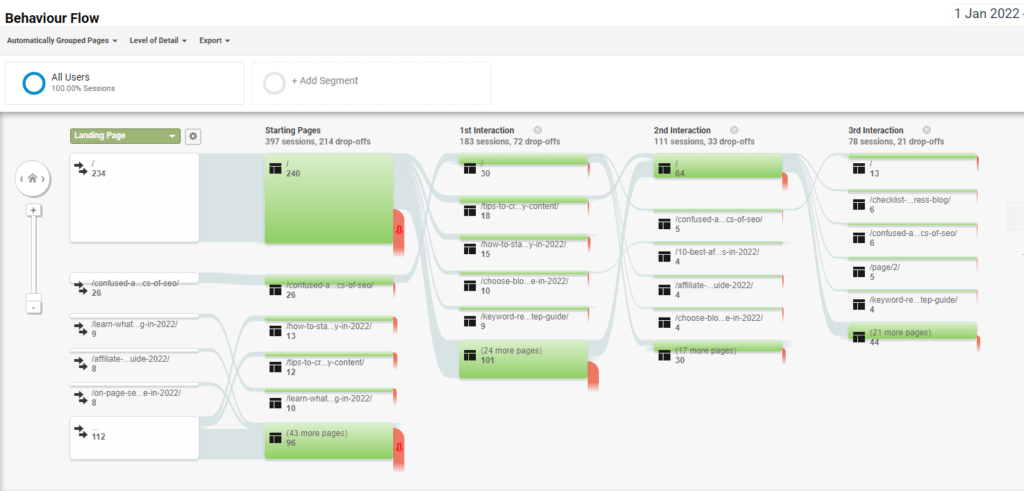
Behavior Flow
This report gives the data about how users are navigating through your website, as in from page 1 to 3 or clicking on some internal link to reach a particular post.
Site Content
In my opinion, this is a very important section in Behaviour Reports as you get data about your posts, landing pages, and web pages on your site.
There are four subcategories under site content, let’s take a look at each of them
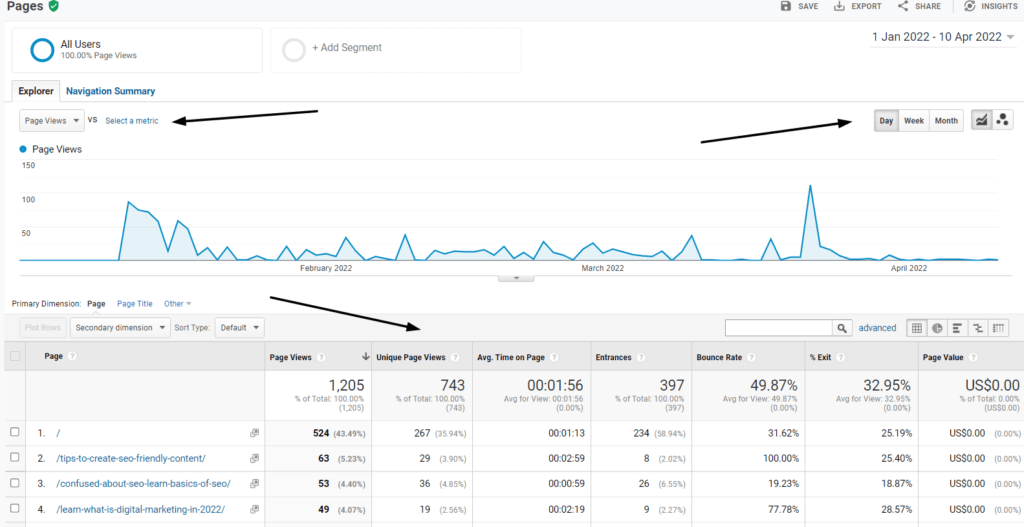
All Pages
As the name suggests you get data about all the pages based views, Unique page views, Avg time on page, bounce rate, and exit of your site.
The main use case of this report is to identify which content page is getting the highest traffic and also the traffic trend of each content page in the growth and gradual decline.
Content Drilldown
This report is useful for large properties which have complex structures like domain.com/blog/ and domain.com/support/ or something similar that have multiple subdomains.
The data you get is in the same format as All pages but the main difference here is you get the data about top folders of content on your website and the top content within that folder.
Landing Pages
The landing page reports are the data about the page on which the user first visits your site.
In this section, you get to know the top pages which are landing the users to your site.
The main use case of this report is when you are selling products on your site because this will tell you the page which has the highest conversion rate and which has the lowest rate.
Using this you can optimize your marketing strategy for each product.
Exit Pages
The Exit Pages report shows the data about the users which page they visited last before exiting your website.
As per my knowledge, most experts say you should monitor this to know why your users are exiting and what you can do to keep them on your site.
In my personal opinion, this is not that important report to look at.
Site Speed
As the term suggests in this section you get detailed data about the speed of your site based on various factors.
Monitoring the speed of your site is very important because it is one of the important elements of SEO.
Optimizing your site speed leads to higher ranking which results in high overall revenue.
How to understand this Site Speed Metrics
- Average Page Load Time – the average time it takes in seconds to load the page after the first click.
- Average Domain Lookup Time – The average time it takes in seconds to fetch the page in the DNS
- Average Server Connection Time – The average time it takes in seconds to establish a TCP connection for a page.
- Average Server Response Time – The average time it takes in seconds for your server to respond to a user request, including the network time from the user’s location to your server.
- Average Page Download Time— The average time it takes in seconds to download a page.
- Average Redirection Time— The average time it takes in seconds to redirect before fetching a page
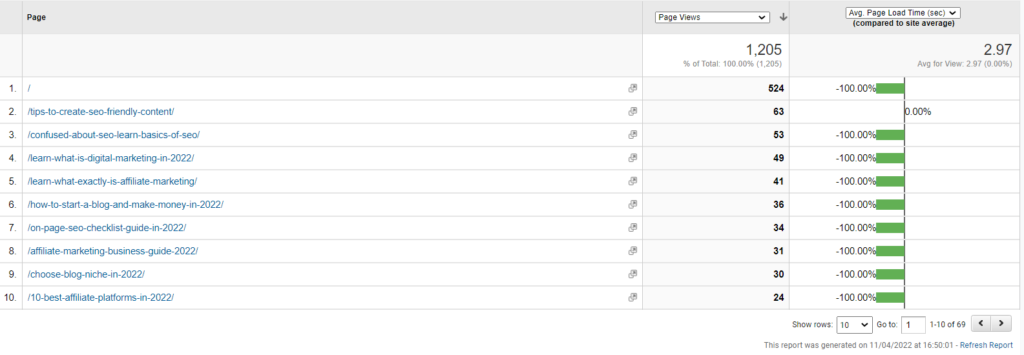
Page Timings
Here you get the data about the average time a page takes to load.
Monitoring this is very important as even single page which has high loading time will affect your overall SEO.
You can identify which pages are taking high time to load and then identify what you can optimize there to make them faster.
Speed Suggestions
Here you get detailed suggestions from Google about all the pages which have speed issues.
You should not go too deep into this analytics as it may become an overly complex thing to resolve each suggestion from Google.
In my opinion, you should identify which page has the highest traffic and should focus only on that page to resolve the issues.
Site Search
There are three main categories that you must check under Site Search, let’s take a look at them.
Usage
In this section, you get the data about how your users are interacting with the search box on your site,
Like how many users used the search box vs the ones who did not use it.
Search Term
In this section, you get the data about what people are searching for on your site, as in what keyword they are typing in the search box to search for some specific query.
Let me tell you how to use this data,
If a particular search query keyword is being searched many times and the content around that keyword is not on your site, then you can make content around that keyword
And if you have already made content around that keyword, then you can just resurface it and optimize it for that search query keyword.
Search Pages
The data you get in this section same as the search term just that the focus here is on the pages where the search began.
Events
In this section, you get the data about how the users are interacting on your site with respect to clicking on the external links, videos, download files, etc,
The data and the information that you get here are very important as you get to know what type of product or video or file is getting more clicks.
Let’s say you have an eBook pdf download button and an external link to a product,
Now if you are getting fewer clicks for your eBook file compared to the external link, you get to know all about it here.
Now you can optimize and make changes like how you should present your eBook to your users so that it can get more clicks.
Basically, you get 4 sub-sections under Events, let’s take a look at them.
Overview
First thing first, to get the data about the events you need to set up an event tracking code and specify the events that you want to track.
In an overview section, you get a quick glance at all the data about the events that you have set in your tracking code.
Top Events
As the name suggests you get data about all the top interactions that happened on your site.
Let’s say you have written a listicle affiliate post about the best Webhosting platforms and have set the tracking code for the buttons here.
So using this section of data you will understand which web hosting platform is getting more clicks,
This will allow you to either optimize other product reviews or get more content on the product that is getting more clicks.
Pages
In this section, you get the data about all the pages which has top interactions with respect to all event that you have set that you want to track.
Let’s say you have multiple pages on your site with products that you want to sell with outbound links,
Here you will get the data about pages that have got the highest outbound link clicks.
With this, you will understand which products are getting good engagement and which are not, allowing you to make changes where they are required.
Events Flow
As the name suggests you get the data (a visual flow graph) about the sequence of the events that happened on your site, like how users first came to your site to how they clicked on the link or button which you have set for the event.
Let’s say you have a landing page and want to sell a video editing software and events happened in this sequence
- A user came to the site
- Read review
- Clicked on the demo video for a tutorial
- Now clicked on the CTA button
This is how you understand the user behavior on your site.
Publishers
This section is related to Google Adsense, so to get the data here you need to connect your Adsense account to Google analytics.
Google Adsense is one way you can monetize your site with Google ads so that your site can make some income from this source.
Google Analytics Conversions Reports
In Google Analytics Conversion Reports you get the data about how the users are interacting with the marketing funnel that you have set on your site.
Let’s say you have your lead magnet(a freebie) on your site to generate leads for your email list or want people to sign up for your webinar, or want to sell some product,
For all this to happen there are a sequence of steps that must happen to achieve the end goal,
So to track this you can set all these steps in your GA conversion report goals and track them.
There are four types of goals that you get in the GA Conversions Report
- Destination – this is a goal that is based on the location of the user when the goal could be set for users if they reach the order confirmation page, thank you page, etc.
- Event – this goal is based on a particular event, like clicking on a link or clicking on a demo video. Etc
- Pages/screens per session – this goal is based on when a user views or loads a set number of pages, like for example a user has viewed 5 pages per session then the goal is completed.
- Duration – this goal is based on when a user views a page for a particular period of time
There are five different subsections under Goals in Conversion Reports, lets’s take a look at them
Overview
In this section, you get the overall data about how your site is performing with respect to conversions that you have set.
Here you get to see metrics like goal value, goal conversion rate, abandonment rate and the breakdown of completed goals, the total number of goals completed.
Goal URLs
If you are selling the same product on three different pages, like let’s say you are selling a Content Marketing video course on three different pages and you get 10 conversions,
Now knowing you have generated conversions is not enough, you need to narrow down and know which page has brought you the maximum conversions.
This is where this metric comes for your help; with this section, you can know which URL page has got you the most conversions.
Using this data you can make changes to the other two pages where you are selling the same product to optimize the conversion rate.
Reverse Goal Path
This section gives the data about the user’s visit path for the last three pages before actually getting converted.
This data becomes crucial if you don’t have a sequential marketing funnel on your site for the product you are selling.
Example
If you have a lead magnet form on various pages on your site like the homepage, about page, pop form, and also on the side of your blog posts.
With the help of the data in this section, you can understand what pages users visited before actually signing up for the lead magnet.
Funnel visualization
This section is very important for sites that have created a proper step-by-step marketing funnel.
Let’s say you have a four-step marketing funnel
- All about the product with a demo video
- Clicking on the Buy button for Add to Cart
- Clicking on the checkout page
- Order Confirmation
Now with help of the data in this section, you can identify where in this funnel the user is abandoning the funnel.
If most of the abandonment is happening at the checkout page, you can optimize it for a better conversion rate.
Goal Flow
In very simple terms, you get to see the visual representation in the form of a flow chart of how your users are arriving at the end goal of the funnel.
With help of this section, you get to see, if your marketing funnel working the way you expected.
E-Commerce
First thing first, you need to activate the eCommerce setting in the GA Admin section and then do a setup by adding the tracking code to your website.
This is a very powerful analytic metric tool for eCommerce websites. Using this section you can track and analyze transaction data, revenue, products you’ve sold, billing locations, and more.
Using this metric you can understand how your marketing funnel is working and what your return on investments are.
Overview
In this section you get to know the overall data about the conversion rate, the number of purchases, revenue, average order amount and the quantity purchased, as well as the top revenue sources and your top-selling products.
Product Performance
As the term suggests you get the data about how your individual product is performing on your site.
The data is collected on the basis of which product is getting the most priority from the customers when buying, the quantities of the products sold, revenue generated by each product.
Sales Performance
As the term suggests you get the data about the over the breakdown of sales performance of the products of your site day wise.
With this data, you can understand the high and low-performing days.
Transactions
Here you get the data about the overall transactions that are happening on your site.
This includes order total, tax, shipping, and quantity information for each transaction.
Time to Purchase
In this section, you get the data about the time, days, and visits taken by the visitor to make a purchase from their first visit to your site.
Final thoughts
I hope you have liked and understood this Google Analytics setup guide. The benefits of Google analytics are huge for any online business with a website.
Use this article as your Google Analytics Checklist, bookmark it and start using the tool right away to scale your business
Google Analytics becomes a little overwhelming when you start using it for the first time, but with time it becomes easy to understand this tool.
Best luck with your business venture.
Also,see
All about Google Search Console
Step By Step On-Page SEO Checklist Guide